Social media without analytics is like diving into an ocean while not knowing how to swim; you’re bound to drown!
We understand that social media is competitive, it’s ever-evolving: you continually need to adapt to new strategies to find out which strategy suits your brand best.
To find out the best time to post or the type of content that results in maximum engagement, you need to evaluate your performance based on past data and make a decision accordingly. That is how you come up with the best marketing strategy in order to cater to your audience.
Before we get into the specificities, let’s discuss social media metrics that are essential in understanding analytics: reach, engagement, and impressions.
Reach vs Impressions vs Engagement: What’s the difference?
Reach:
The total number of people who see your content.
Reach is the number of distinct people who see your content. Of course, you would want each one of your followers to see the content you have posted, but that’s not how things work on social media. That’s why understanding Instagram Algorithm is so important.
If 500 people have seen your post, it means that your post’s reach is 500 people.
Impressions:
The number of times your content is displayed, even if it was not clicked.
The impression means the content was delivered to someone’s feed, but the viewer doesn’t necessarily engage with that post. This also means that one person could have multiple impressions for a single post.
Let’s say if the post has appeared on people’s screens 1,000 times, that means: the total number of impressions for that post is 1,000.
Do note that the number of impressions a post earns greatly corresponds to how well the brand is doing. Are you cross-promoting effectively? Are you choosing relevant hashtags?
Engagement:
How the users interact with the content that is published. This is measured in terms of how well is your brand connecting with the audience. Do keep in mind that the Instagram algorithm is always changing, so engagement will vary.
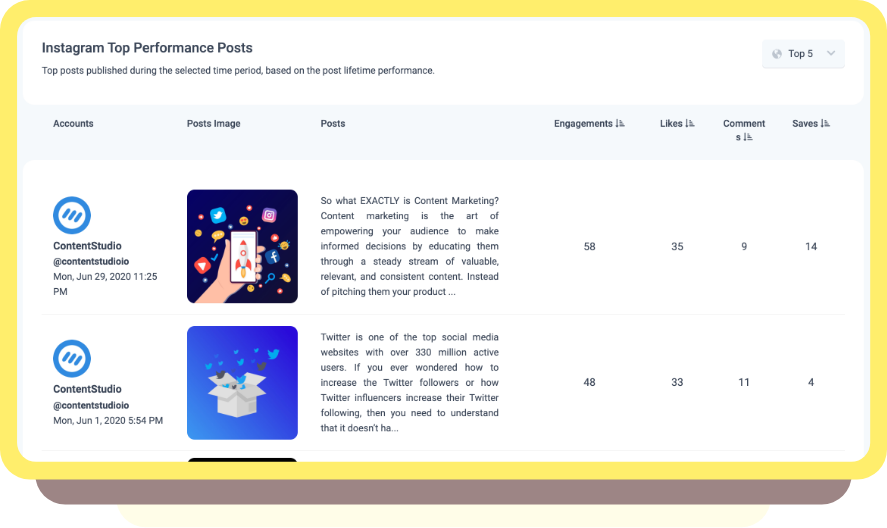
In the above example, you can see that number of engagements is added up for you on Instagram: it’s an addition of likes, comments, and saves.
Profile Actions:
The total number of times users clicked on the links within your profile to contact you, get directions, or visit the link in bio.
How does ContentStudio’s Instagram Analytics Work?
With ContentStudio’s Instagram Analytics, you can shape your strategy for maximum growth. With our visually appealing, easy-on-the-eyes graphs, you can track, and monitor your progress.
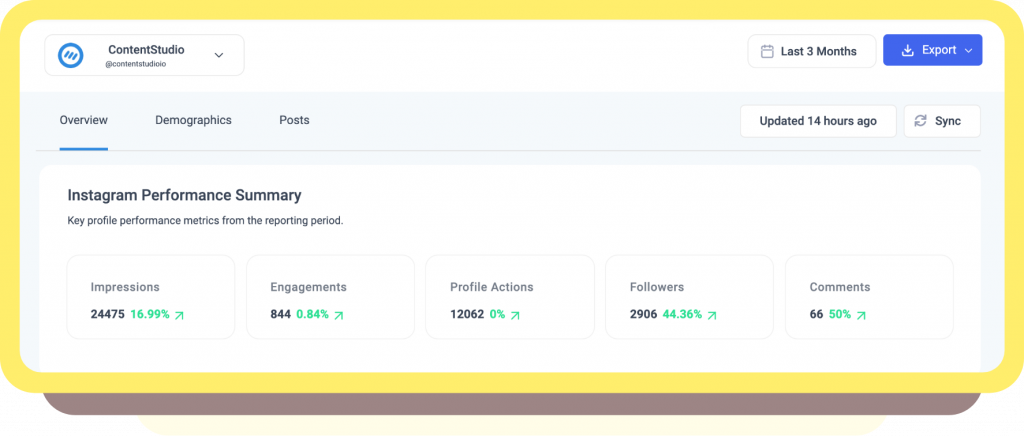
Note: Make sure to sync your results to include the latest likes, and comments for accurate and updated analytics.
Audience Growth
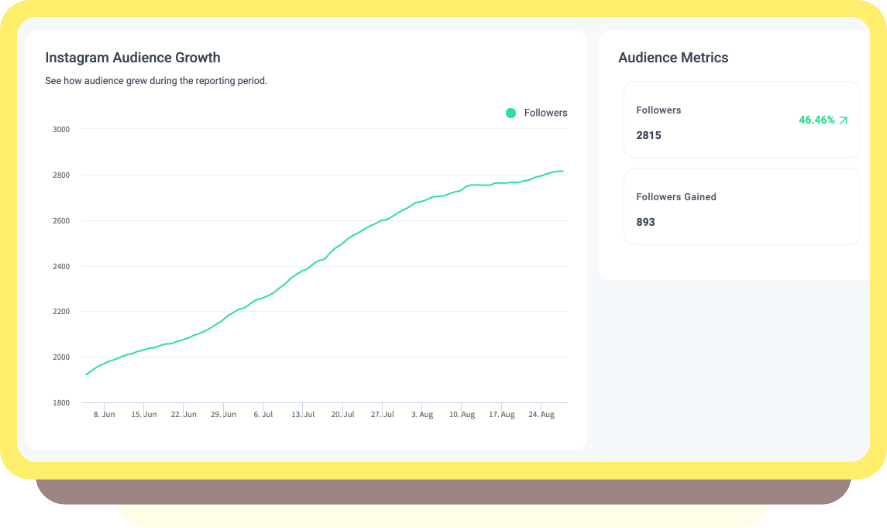
Tracking the growth of your audience will help analyze the rate of increase or decrease in followers over a period of time.
You can benchmark these statistics daily, weekly, monthly, or yearly to determine the speed at which you’re attaining new followers. You can evaluate performance on each social media platform to investigate where your brand is doing best.
Remember to sync the statistics to get the most updated results from social media!
Study top posts

At the end of each week, you can analyze your posting activity to see which posts had high engagement (resonated most with the audience), and which had a high reach. Perhaps, you had posted about a certain topic that users are more interested in?
Likewise, which posts got the least engagement? Were they posted at a time when users weren’t active? Was the content not interesting enough?
With this relevant information, you can plan the content for next week!
Understand your reach
By having a detailed breakdown of your audience, you can revamp your marketing strategy to match your target audience.

So ask yourself: who is your primary demographic on social media? What is their age bracket, and what kind of posts will appeal to them? Where exactly in the world are they located?
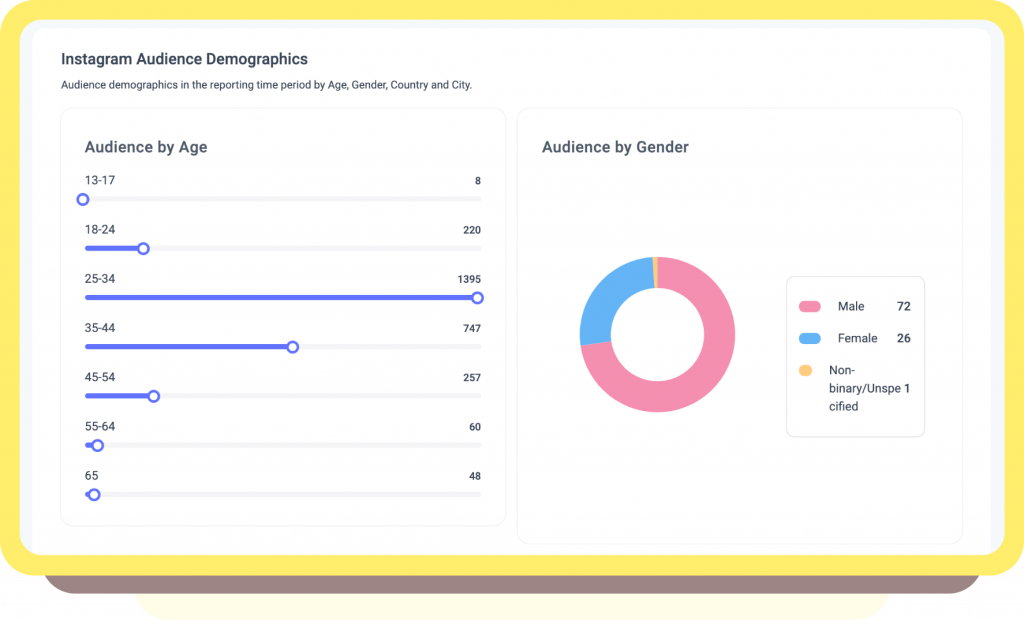
Furthermore, you could experiment with trending local hashtags to maximize reach and consider their peak times to match that behavior!

If you haven’t yet tried Instagram ads, and you have a few bucks to spare, I suggest trying that as well! The insights gathered from the organic reach will be particularly helpful while designing a paid campaign.
Consider the Best Time to Post

Being a content curator, you would know how difficult it is to stand out and increase the reach of your posts. With new updates, social media algorithms turn away from a chronological timeline to a relevance-based curation. To complicate matters, each social media’s posting time and frequency is different!
If you do have resources at hand, you can experiment to find these statistics yourself, with the help of Analytics.
For the highest reach, engagement, and exposure, it is essential to refine your strategy to when, where, and how much.
Bonus Tip:
This is where maintaining different Content Categories or a Content Calendar to plan and optimize your content is helpful. Making use of a comprehensive content calendar will help you schedule and diversify your content. If the best time to post is at 3 am at night in your time zone, you can schedule and automate posts in advance!
Instagram Stories

Stories may disappear after 24 hours, but Instagram Stories Analytics are forever! (metaphorically, of course! 😉 )
Research has been conclusively demonstrated the positive impact of brand stories. 1/3rd of the most viewed stories are some businesses. What’s more, thirty-nine percent of people said that Instagram Stories have led to an increase in interest in a brand/product.
There is good news though: there’s so much potential. You can learn to measure the analytics and track the essential metrics to optimize Stories. Engage with followers, stay on top of the minds of your customers, and perhaps, make even more sales.
You can see Instagram story analytics, such as total stories published, story replies, tap backs, tap forwards, exits, reach, and impressions.
Story Reach:
The total number of unique accounts that viewed your story.
Story Impressions:
The total number of times the story was viewed. This includes repeat views.
Story Replies:
The number of times individuals have directly replied to a particular photo or video in your story. However, unlike comments on a post, these replies end up in your inbox and are not public.
Forward Taps:
The number of times someone tapped to the next story.
Back Taps:
The number of times someone tapped back to see the previous story.
Exit Story Taps:
The number of times someone exited your story. These measures can be incredibly telling, revealing exactly where and how to retain users.
Reporting
Reporting is a process of compiling, and organizing your factual data by presenting it into visual, written, or spoken summaries.
Export your reports (white-labeling soon!) and share them with your colleagues.
Productivity points?
At the end of the month, you can also auto-schedule your reports to be sent out to your clients, or your team members:

Limitations to keep in mind:
- Insights on IG Users are only available on IG User accounts that have 100 or more followers.
- Analytics for Instagram Stories is available only for those with more than 5 views.
- Only available for Instagram Business Accounts.
Build your Instagram strategy now.
Empowered by this understanding of different metrics and KPIs, you can now work on building the perfect strategy to suit your brand.
But before you do, the most important thing to keep in mind is that data is strictly contextual!
Do not let the supposed successful metrics stifle your creativity. Instead, you can use these statistics as a means to validate what your gut feeling tells you or lead your next steps!
I hope that with Instagram Analytics, you are able to make a real, positive difference to your Instagram Business account. Let me know what you think in the comments!
Leave a Reply